
@matteo_spada
Essential App Metrics for App Health Monitoring
Have you ever wondered if your app is healthy? In this article, we will try to answer this question. Like doctors, we will analyze all app metrics of our application one by one to find out if it is doing well or requires some minor intervention.
I will explain to you how to use app analytics to understand your app’s performance and make data-driven decisions to improve user engagement and retention.
The article will be divided into sections based on the app analytics tool used to track the specific app metric. This way, not only will you know what to track, but also where to find the specific data.
At the end of the article, you will have a clear understanding of which mobile app KPIs to monitor to know if your app is performing well
Although this article is mainly aimed at iOS developers, the listed parameters can also be used for Android applications.
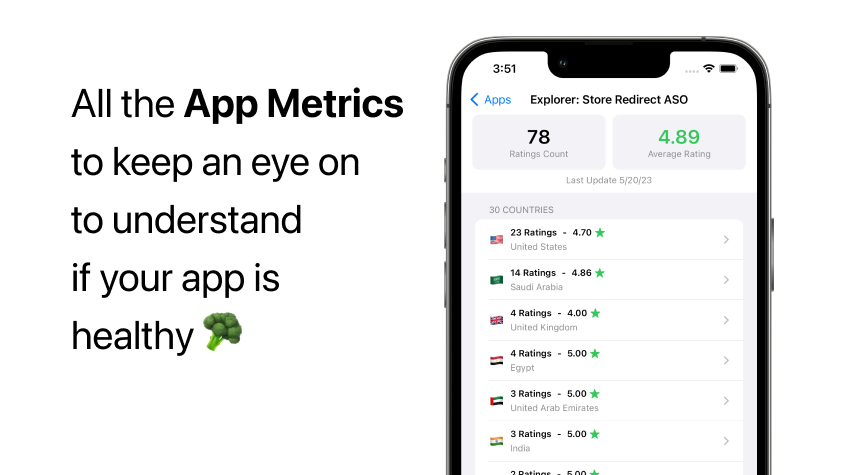
App Store Connect
App Store Connect can already provide a lot of information to determine the health status of our app. Among the values to consider, which allow us to make important considerations, are:
Impressions
The number of impressions gives us an indication if our App Store Optimization or Marketing strategy is yielding results. If you want to increase the number of your impressions, you may be interested in reading my free ebook The Perfect Keywords.
Page Views
The number of page views tells us how many people, after seeing our app in the store, then clicked to visit our page.
The number of app downloads.
Simply how many users have downloaded your app.
Conversion Rate (Download/Impression)
By using these three values, we can calculate two different conversion rates. The first one is obtained by dividing the number of downloads by the number of impressions and multiplying it by 100:
(Number of downloads / Number of impressions) * 100
Conversion Rate (Download/PageViews)
The second one is obtained by dividing the number of downloads by the number of page views and multiplying it by 100:
(Number of downloads / Number of page views) * 100
Between the two, the second one is the most interesting and gives us a clear indication of how well our App Store page is converting.
The conversion rate varies greatly depending on the app category but can range from 86% to 2.9%, as can be read in this article by apptweak.
If we notice that our conversion rate is lower than the reference rate for our category, we can consider improving the ASO of our app. If you’re interested, I have written a free ebook about it.
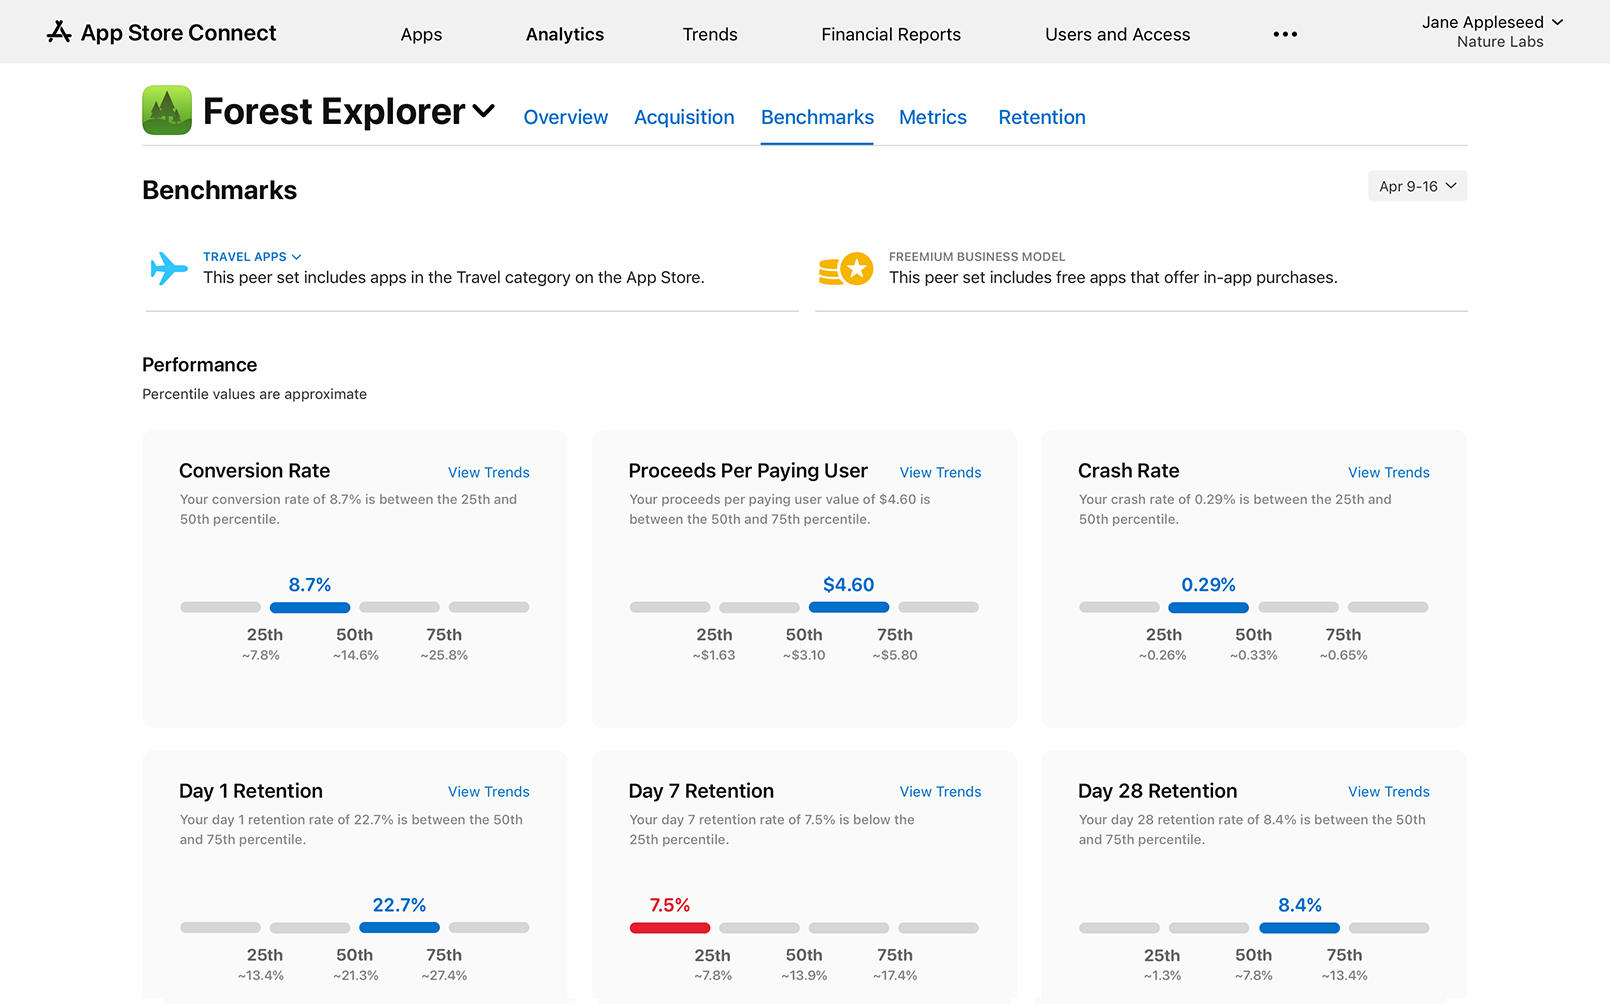
Retention
Retention is one of the fundamental factors to analyze to evaluate the performance of your app.
The more users use your app, the greater the chances of earning. However, don’t be discouraged by the numbers: only 25% of people who download the app will open it a second time, which is perfectly normal.
What’s important is not to fall below average values. To easily understand how your app is performing, you can consult the Benchmark section of App Store Connect.
If the retention values are low, you can remedy this by adding features in the app that encourage the user to reopen it daily or perform simple actions, such as sending notifications to users.
Number of Crashes
The number of crashes is a clear indicator of the health status of our app. Many crashes mean a bad user experience and can lead users to completely uninstall your app.
Number of Uninstalls
Often, we tend to focus a lot on the number of downloads and ignore the number of uninstalls, yet this data is important and can give us valuable insights into how much users appreciate our app.
App Analytics Tool
The following metrics can be monitored using an app analytics tool. Firebase analytics is one of the most well-known tool for this purpose, but personally, I prefer to use TelemetryDeck for my apps.
This tool offers a minimal interface and respects user privacy. Additionally, it allows you to run queries to extract data more easily.
Activation Rate
It may sound absurd, but many users, after downloading apps, never use them. Therefore, it is important to monitor the app’s activation rate. If this rate is below 85%, it is necessary to analyze the problem more carefully.
Purchase Metrics
After the user opens our app, we can monitor two other metrics:
- Percentage of users who make a purchase and
- Paywall conversion rate.
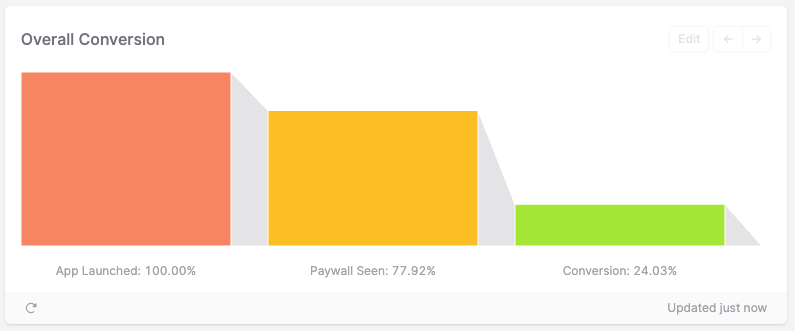
To track the paywall conversion rate, it is sufficient to send a signal to TelemetryDeck every time we show the paywall and another signal of confirmed purchase when the user completes the purchase.
This way, you can easily extract this information through a query and monitor the paywall conversion rate over time.
A good paywall conversion rate is around 1%. If this value drops, it is necessary to investigate the problem.
If the app includes a free trial, it is also useful to monitor the percentage of users who cancel the subscription before the end of the trial period.
Engagement
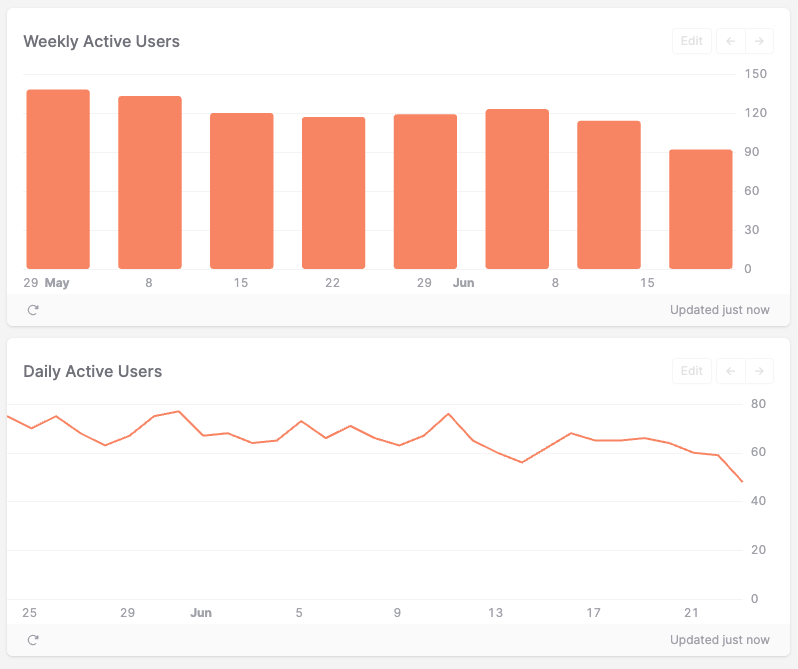
To evaluate user engagement, there are two metrics to consider: Daily Active Users (DAU) and Monthly Active Users (MAU). These metrics indicate the number of users who are active daily and monthly in the app, respectively.
The DAU represents the number of unique users who have used the app at least once during the day. This metric is particularly important because it indicates the actual usefulness of the app for the user. Additionally, the DAU allows you to monitor any fluctuations in app usage over time.
The MAU, on the other hand, represents the number of unique users who have used the app at least once during the month. This metric is useful for evaluating the app’s popularity in the long term and for identifying any trends of growth or decline in app usage.
Both metrics can be used to evaluate user engagement and to identify any issues in the app that may affect user usage.
I use TelemetryDeck to analyze these metrics.
Mobile Attribution Partners
To evaluate the health of our app, it is important to analyze the metrics previously described. However, if the app is not sufficiently visible on the App Store to receive enough downloads, marketing strategies such as App Store Optimization can be used to try to obtain organic traffic or purchasing advertising.
Return of Investment (ROI)
In case you are using paid advertising, it is important to consider other metrics, such as Return on Investment (ROI).
This data indicates how much we have earned by spending, for example, $100 on advertising.
To obtain this value in the most reliable way possible, it is necessary to use a Mobile Attribution Partner.
These services act as intermediaries between our app and the advertising network (for example, Meta), aggregating data from both Apple and Meta to provide a clear picture of the effectiveness of our advertising.
Additionally, using an MDM allows us to understand which advertising platforms work best for our app so that we can invest our money better.
One of the most well-known services of this kind is AppsFlyer, which also offers a free plan.
Conclusions
Tracking these indicators will give you a clear picture of the health status of your app, as well as save you time and money.
If you would like to comment on the article or talk about your own projects, you can find me on Twitter!